 Whenever we wish to get the position of bluetooth devices we have to make requests to the API provided by the underlying OS. However, different environments also mean that we can get different results. This article will cover the 3 main mobile OSes: Android, iOS and Windows.
All three operating systems have access to the Received Signal Strength Indicator (RSSI) value which in turn is used to calculate distance to the tracked device. However this information is not actually made public by the OS. Why? The answer is quite simple, but before answering that, let's add some context.
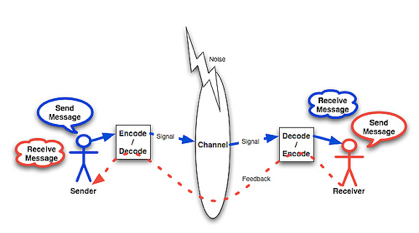
Telco engineers are the ones in charge of designing end-to-end communication systems, starting from the data to send, conversion to analog, then electro-magnetic, radiation, reception and finally undoing all conversions steps in order to obtain the original data (essential steps have been omitted as they require deeper understanding on the subject matter). When transmitters and receivers are designed, they have to take into account the distance that they wish to cover (if that is the objective) or, given a set of devices with their specific physical characteristics, calculate their communicating distance. In order to do that, the Friis equation is used:
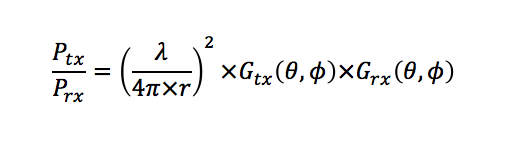
In the equation above, there are several physical design parameters that need to be known in advance for both transmitter and receiver to be able to calculate gain as a function of θ and ϕ. Given an RSSI value provided by an operating system, it is still necessary to know the physical design of the receiver. And even so, the equation shown above is only valid in ideal conditions: we would still need to include signal drops and losses due to medium, multi-paths, etc..
 For instance, Apple manufactures their own devices which allows them to calculate distances to devices. This value, however, is not exposed in their API even though you can print it to the console. And they are able to do so since they do have many of the parameters required and can solve the Friis (or a similar) equation. My guess is that Windows and Android cannot follow the same procedure as the OS is installed in devices from various manufacturers and to provide a similar value, it would require manufactures to modify the OS and provide specifications for antennas, values for gain, etc..
A practical scenario
So let's assume that we want a list of beacons sorted by proximity. If we assume (as I guess iOS does) that all devices are ideally similar (transmission intervals, etc.) and that all measurements are collected using the same reception parameters, then which one changes? The power, RSSI. We can use RSSI directly to discover which device is closer and since this value is already given by the OS, reduce the number of calculations that we would have to perform which in turn gives a smoother user experience in devices with limited performance capabilities.
Finding the closest device
Since we have established that we can work directly with RSSI, we can then proceed to develop and run a simple Hello BLE code either from a laptop, tablet, mobile phone, etc.. to discover nearby devices.
However upon running our program, the first thing we will notice is that there is an oscillation in the RSSI value received from nearby devices. As mentioned before, this is a result of environmental loss introduced by diffraction, materials with different attenuations, obstacles, etc.. In fact, there are specific calculation models for interiors where the distance parameter (r) can be solved not by powers of 2 as in the equation shown above but by powers of 6 or even 8 plus other additional parameters due to the elevated loss in closed spaces. And to add to that, we need to include interference from other communications devices and electric appliances that can also cause fluctuations.
A key principle in telecommunications is that there is always a compromise. In this case, the compromise is not to rely on only one sampled value but to calculate the average of a sampled set. The more samples we collect the more precise our calculation will be and of course the more time it will take.
In our tests we have used 6 sample values; the time to collect these depends on the device capabilities. This variation in time happens even when the transmitter uses a fixed frequency, and it is a result of how the device scans for devices. If we scan directly with the bluetooth API we can quickly collect all the samples needed albeit with higher power requirements. If we scan using the Bluetooth Low Energy (BLE) APIs instead then the power consumption is much lower since the OS decides when to sample. The sampling time varies from device to device and cannot be get or set via API.
 It would seem that the amount of time required to collect samples is proportional to a user's patience, or rather impatience: the longer the wait the more impatient the user becomes. In an effort to reduce this time we can use a movable median: once we reach the number of samples we want, new samples are added to the list and the old ones discarded while the average is recalculated. In this way we constantly update the value with the latest samples and the app will only take a bit more time the first time it is launched.
It is worth noting that the amount of samples to collect (6 in our case) is enough to ease the variations in different RSSI measurements (oscillations) but not enough to rapidly detect variations in direction, for instance, as when a person walks. If the user were to be running running then a lower number of samples would be more beneficial to detect variations.
Moving out of beacon range
Another consideration is what happens when the user moves out of range from the desired device. In this scenario, the last collected sample will have a very low RSSI value. Thus, when the next scan is performed and the beacon is no longer found, the old values in the list will be discarded until the remaining one is the last value received. Another possibility is to discard the list completely, however this must be done carefully as there might be cases where a device is not detected temporarily due to interference.
Predicting the next device
It is all very well to know which device is the closest but, what about guessing it? The human being has always wanted to predict the future - and in our demo, not only we wished for it but we actually accomplished it!
 At first, we can try and predict using the latest samples but as we mentioned before, due to external factors such as interference of other devices, we could end up using fluctuating data which would then lead to misleading information. And if we average the samples then our predictions would be much slower as the calculation would ease variations in the latest samples. So, what are we left with?
The solution could be to calculate a trend, a very simple technique widely used in many reporting scenarios. The trend line for a sample set is represented by y = m * x + n but instead of using RSSI values we use the last 6 calculated averages. In this way we are less like to obtain a trend line with larger fluctuations (due to oscillating RSSI values) thus increasing our chances to accurately predict to which device we are moving towards to.
In our test scenario with direct visibility to the devices and distances ranging from 3 to 4 meters between them, moving the receiver at 0,6 m/s - after standing still for a bit of time next to one of the beacons - the algorithm predicts using 10 samples more than the size of the sample set (which was 6 as previously mentioned), a total of x = 16. Should this value be inferior then the distance between them should be larger for the prediction to be effective and without delays.
Improvements
If the results are not acceptable enough for the requirements, there are aspects of the algorithm that can be improved.
One aspect would be speed: the receiver is moving at high speed therefore the time spent within a ranging zone is greatly reduced, thus reducing the number of samples which can potentially turn all trend lines to look similar. In order to solve this the first step would be to actually use a weighted trend calculation instead and set more weight to the newest values instead of the oldest ones.
Another aspect, this time related to predictions, is that instead of using a straight line we could potentially use a parabolic curve to put emphasis on the future direction. This would yield a more precise result since straight lines are worse suited to slope oscillations.